The first half is the same as the code at the beginning here.
Only the subsequent simulator operation part is described here.
# Get diagnostic results
$sim.ToggleMenu([Simulator+SettingToggleMenu]::LowPowerMode, $true)
Start-sleep -Milliseconds 500 # Earn time to update the screen
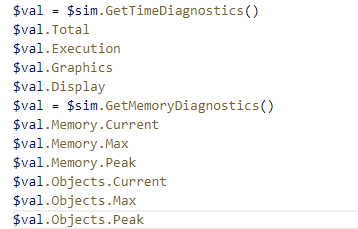
$val = $sim.GetTimeDiagnostics()
$val.Total
$val.Execution
$val.Graphics
$val.Display

$val = $sim.GetMemoryDiagnostics()
$val.Memory.Current
$val.Memory.Max
$val.Memory.Peak
$val.Objects.Current
$val.Objects.Max
$val.Objects.Peak- 2~8行目:Get the number displayed in Watchface Diagnostics

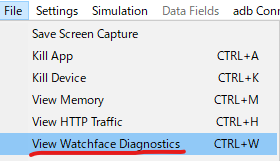
Dialog launched from here.
The measurement in this dialog is performed only when LowPowerMode is checked, so the check is turned on in the second line. - 10~16行目:Get the number displayed in the Active Memory dialog.
Currently, only the contents of Memory Usage Status are acquired.
The content expressed in the Tree below it has not been acquired.

コメント