“WatchUi :: WatchFace :: onUpdate ()” is called once per minute in the low power mode and once per second in the high power mode.
However, if the “onUpdate ()” process takes a long time even in the high power mode, the update timing is once in a plurality of seconds.
Actually, how long it takes for the update process cannot be measured as it is, but can be solved by the following method.
Measurement method
“WatchUi :: WatchFace :: onPartialUpdate ()” is available from SDK 2.3.
This method is prepared as a mechanism that can always update once a second, and is called once a second as long as the processing time in the method is less than a certain fixed time.
Therefore, a mechanism capable of measuring time has been prepared for this processing.
Display of measurement results
The measurement results are displayed on a device simulator.
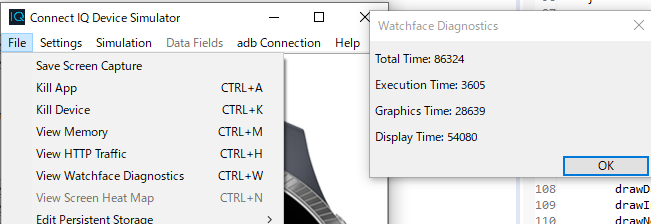
When “File-View Watchface Diagnostics” is selected, the time taken for “onPartialUpdate ()” is displayed.
The time displayed here seems to be μ seconds. (I can’t find manuals for the device simulator, so it’s hard to guess.)
The reason for using μs is that the measurement result of WatchFacePowerInfo called by “WatchUi :: WatchFaceDelegate :: onPowerBudgetExceeded ()” prepared in connection with “onPartialUpdate ()” is millisecond.
The result of calling “onPowerBudgetExceeded ()” in the program where the above information is displayed is as follows.
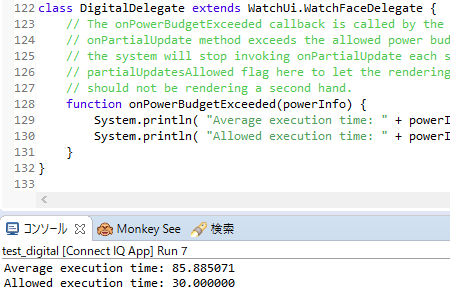
The average execution time was 85.8 milliseconds, and the total time displayed on the device simulator was 86324, so it was determined to be microseconds.
To perform measurement
First, put the following code in a class that inherits WatchFace.
    function onPartialUpdate( dc ) {
    	onUpdate(dc);
    }
For devices that can only use SDK 1.x units, the above code is ignored, but this time use the functions of SDK 2.3 or more just to measure the time required for onUpdate ().
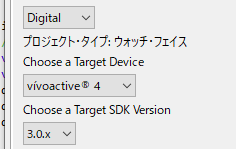
Next, the execution model of the watch face should be a watch with SDK 2.3 or higher.
I used Vivoactive 4 this time.
Now you can run the simulator and see the Watchface Diagnostics.
Watchface Diagnostics Contents
The following judgment is made based on the changed information by playing with the actual code.
- Execution Code
Code execution time. The content changes when the implementation is changed. - Graphics Time
Time to draw graphics via DC. Because it changes with the increase or decrease of the drawing content. - Display Time
unknown - Total Time
Execution Code + Graphics Time + Display Time
Notes
If the device you want to use uses onPartialUpdate () in its original sense with SDK 2.3 or higher, it may be a little troublesome to measure the time of onUpdate ().
It may be better to prepare the actual process that performs onPartialUpdate () separately and call the process you want to measure because there is no onPartialUpdate ().
Like the following.
    function onPartialUpdateReal(dc) {
    	// Write the actual onPartialUpdate process here
    }

    function onPartialUpdate( dc ) {
    	// Execute the process you want to measure
    	onUpdate(dc);
    	// onPartialUpdateReal(dc);
    }
The result of a simple measurement
I examined how much speed can actually be increased.
The result of the measurement of “Making Garmin Watch Face: Digital Clock” was as follows.
Execution: 3.8ms, Graphics: 25ms
After adding processing to display seconds, it looks like this:
Execution: 3.9ms, Graphics: 28ms
The actual display looks like this.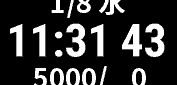
Adding just three characters will increase the processing time by about 3ms.
In addition, the result of removing the processing that seems to be useless in the implementation part is as follows.
Execution: 3.6ms, Graphics: 28ms
What we did was to optimize the coordinate calculations used to draw the graphics a bit more, instead of using Lang.format to generate the strings, we used + to generate the strings.
As a result, the optimization performed on the execution processing portion does not have a large effect, but does the increase or decrease of the graphic rendering content significantly affect the processing time?
コメント